

Welcome to the joint EPISCOPE and TABULA Website
|
+++++ LAST PUBLICATIONS ++++++++++ LAST PUBLICATIONS ++++++++++ LAST PUBLICATIONS ++++++++++ LAST PUBLICATIONS +++++ 2017-11 | Building Typology for the country Bosnia and Herzegovina now available: Country Page: <Link> TABULA WebTool: <Link> 2016-03 | Final EPISCOPE Project Report: Monitor Progress Towards Climate Targets in European Housing Stocks <PDF>| 2016-03 | Reports: Scenario Analyses on Local Building Stocks <PDF> Regional & National Building Stocks <PDF> and Monitoring <PDF>| |
|
|
IEE Project EPISCOPE
Basic Idea |
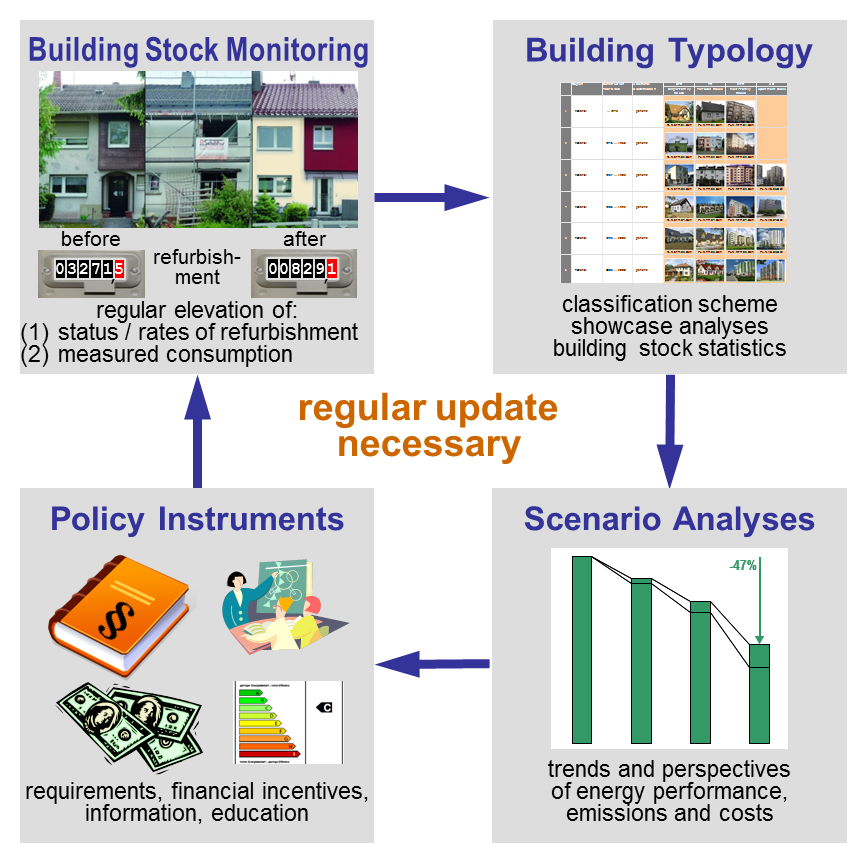
The overall strategic objective of the EPISCOPE project was to make the energy refurbishment processes in the European housing sector transparent and effective. This will help to ensure that the climate protection targets will actually be attained and that corrective or enhancement actions can be taken in due time, if necessary.
Starting point was the TABULA concept of residential building typologies which was continued and expanded.
As a further step the scope was extended towards the elaboration of building stock models to assess refurbishment processes and project the future energy consumption. Case studies were conducted in 16 countries to track the implementation of energy saving measures and their effect on the consumption in practice.
A main outcome is a concerted set of energy performance indicators which shall enable key actors and stakeholders on different levels to ensure a high quality of energy refurbishments, the compliance with regulations, to track and steer the refurbishment processes in a cost-efficient way and to evaluate the actually achieved energy savings. A long-term objective was to install bottom up monitoring procedures in each European country in different fields: in energy certificate databases, representative surveys, regional or national census, heating or energy bills, strategic asset development, energy management.